When you start working with a new client, one of the first things you’ll want to do is audit their current social media efforts.
This means analyzing your client’s ad account and making sure everything is connected and working correctly. Are their pixels set up and tracking the most efficient key metrics for their business? Have their custom audiences and lookalike audiences been created from their website traffic, social media engagement, and customer database? If your client is a well established company then it’s likely that all of this is set up and will only take a few minutes to review.
More importantly, you’ll want to analyze all of your clients’ previous ad campaigns in order to draw conclusions that will prevent you from wasting time, money, and energy re-testing variables that have already been thoroughly tested. Understanding a clients’ social media history is essential in order to develop an effective social media strategy going forward.
This social media audit template provides step-by-step instructions and screenshots that will enable you to effectively and professionally audit and report on a clients’ social media progress.
Table of Contents
1. Summary (findings)
2. Overall Performance
3. MoM and YoY Performance
4. Ad Account Health
5. Demographics and Gender Targeting
6. Creative Performance
7. Campaign Performance
8. Placement and Device Performance
9. Location Targeting
10. Overall Best Performing Ad Campaigns
11. Organic Performance
12. Next Steps
Summary (Findings)
The summary is the first thing your client will read and it is a conceptual overview of your findings. This can be provided in bullet points or in simple terms that all stakeholders can understand from a quick glance. Hold off on any suggestions or conclusions until the end of the report; keep this section focused on declarative sentences about what you’ve learned from analyzing their social media efforts.
Since this is a conceptual summary there is no need for any charts or graphs in this section.
Overall Performance (Scorecard or Dashboard)
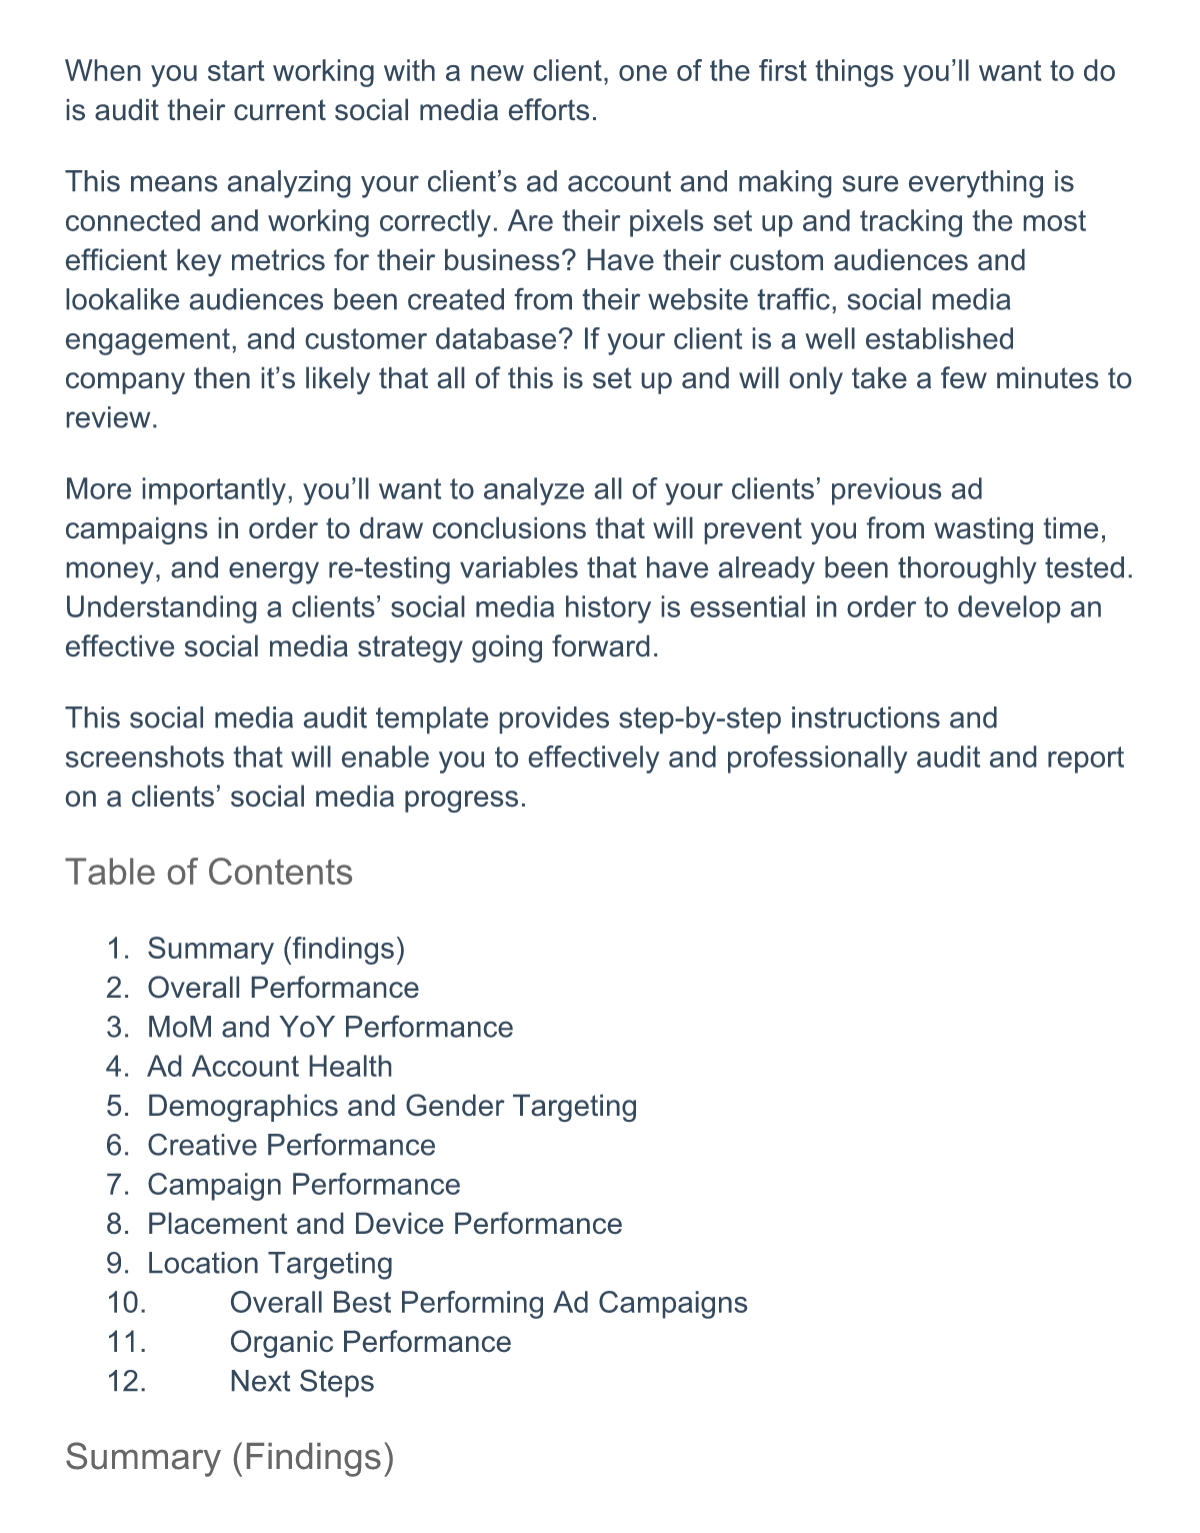
This section is a visual representation of the key performance indicators (KPIs) that have been pre-determined by you and your client. Think of this as the scorecard or dashboard that can be frequently glanced at to see a quick idea of overall performance. The date range for the dashboard will be from the date you ran the last report until yesterday - you only want to include full days in the report.
MoM and YoY Performance
Depending on how long your client has been running ads will determine whether you’re providing month-over-month (MoM) or year-over-year (YoY) reporting or both. Generally, you will be providing MoM reports each month and maybe once a quarter you will provide MoM and YoY reporting.
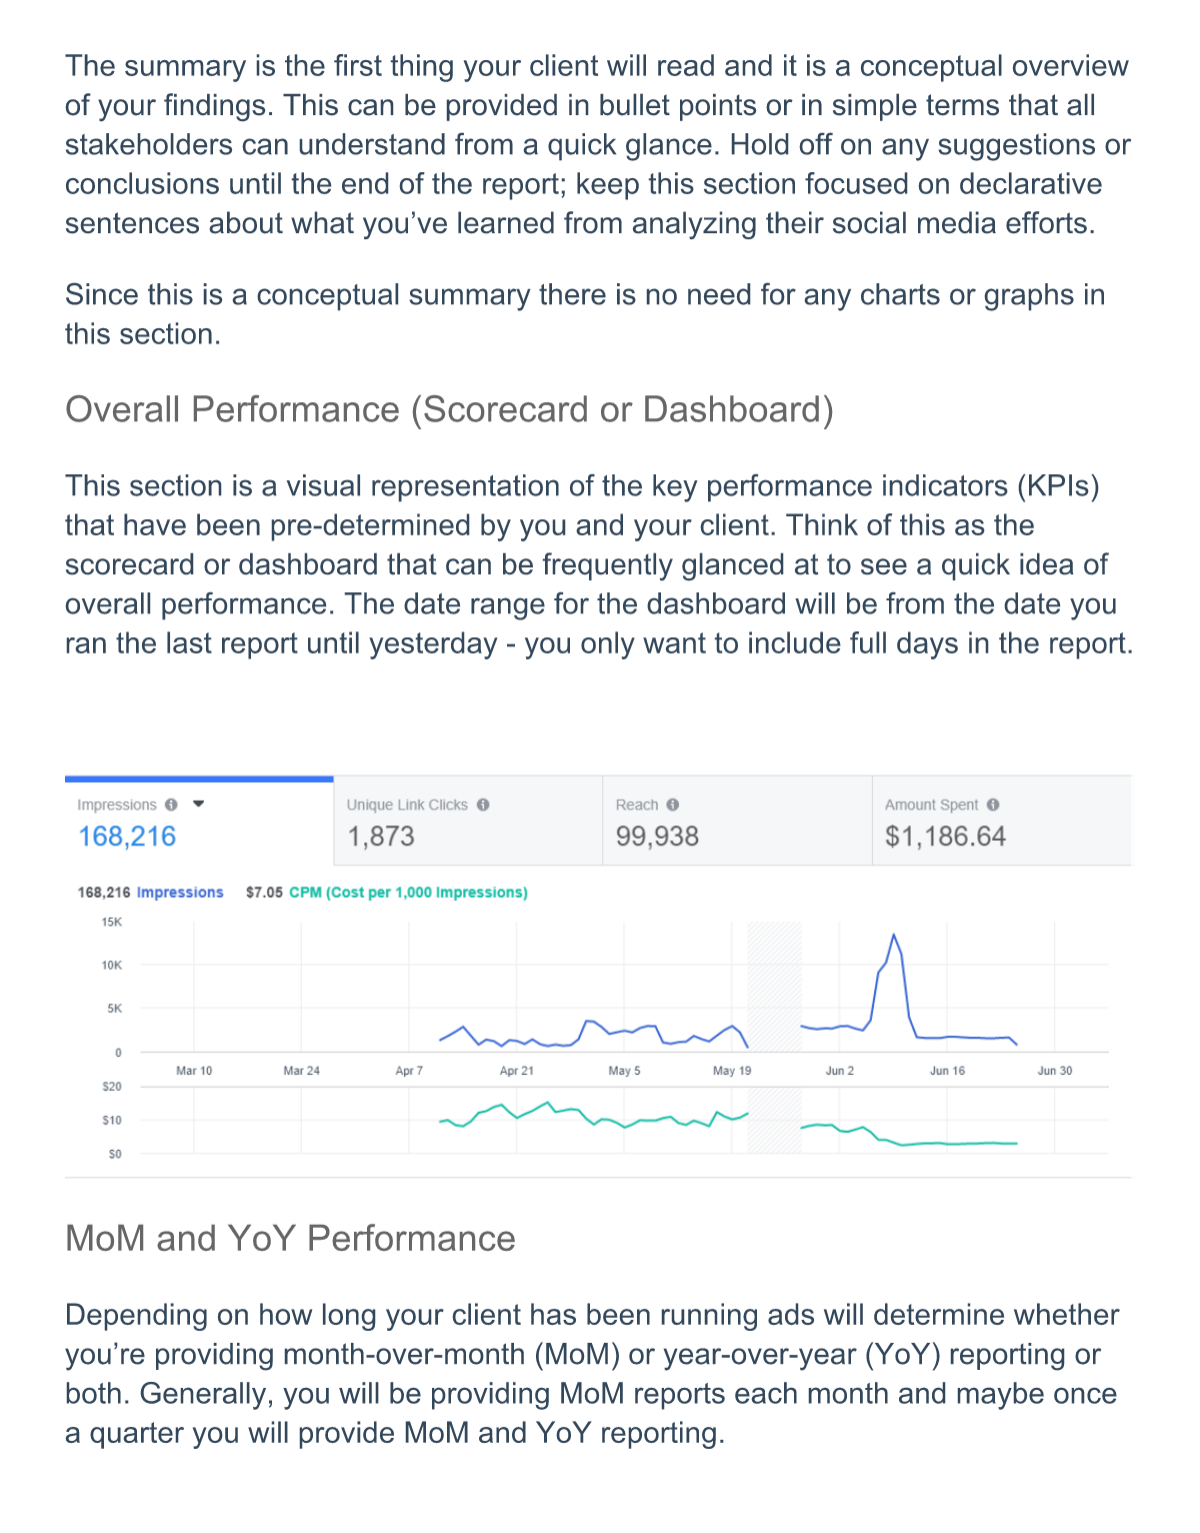
When providing MoM stats, it’s important that you understand the cause of data and that you can explain it to a room of stakeholders. If there is a 40% decrease in the average cost per click (CPC), that’s great news but they will want to know what caused it so that it can be replicated - and vice versa for negative stats
Ad Account Health
This may only be necessary the first time you work with a client, but it is a health report of their current social media accounts. By the time you provide the report, it is very lucky that you may have already fixed all the errors but it is still good to show what has been done.
This might include creating new custom or lookalike audiences, adding custom parameters to the tracking pixel so you can track KPIs, and more.
Demographics and Gender Targeting
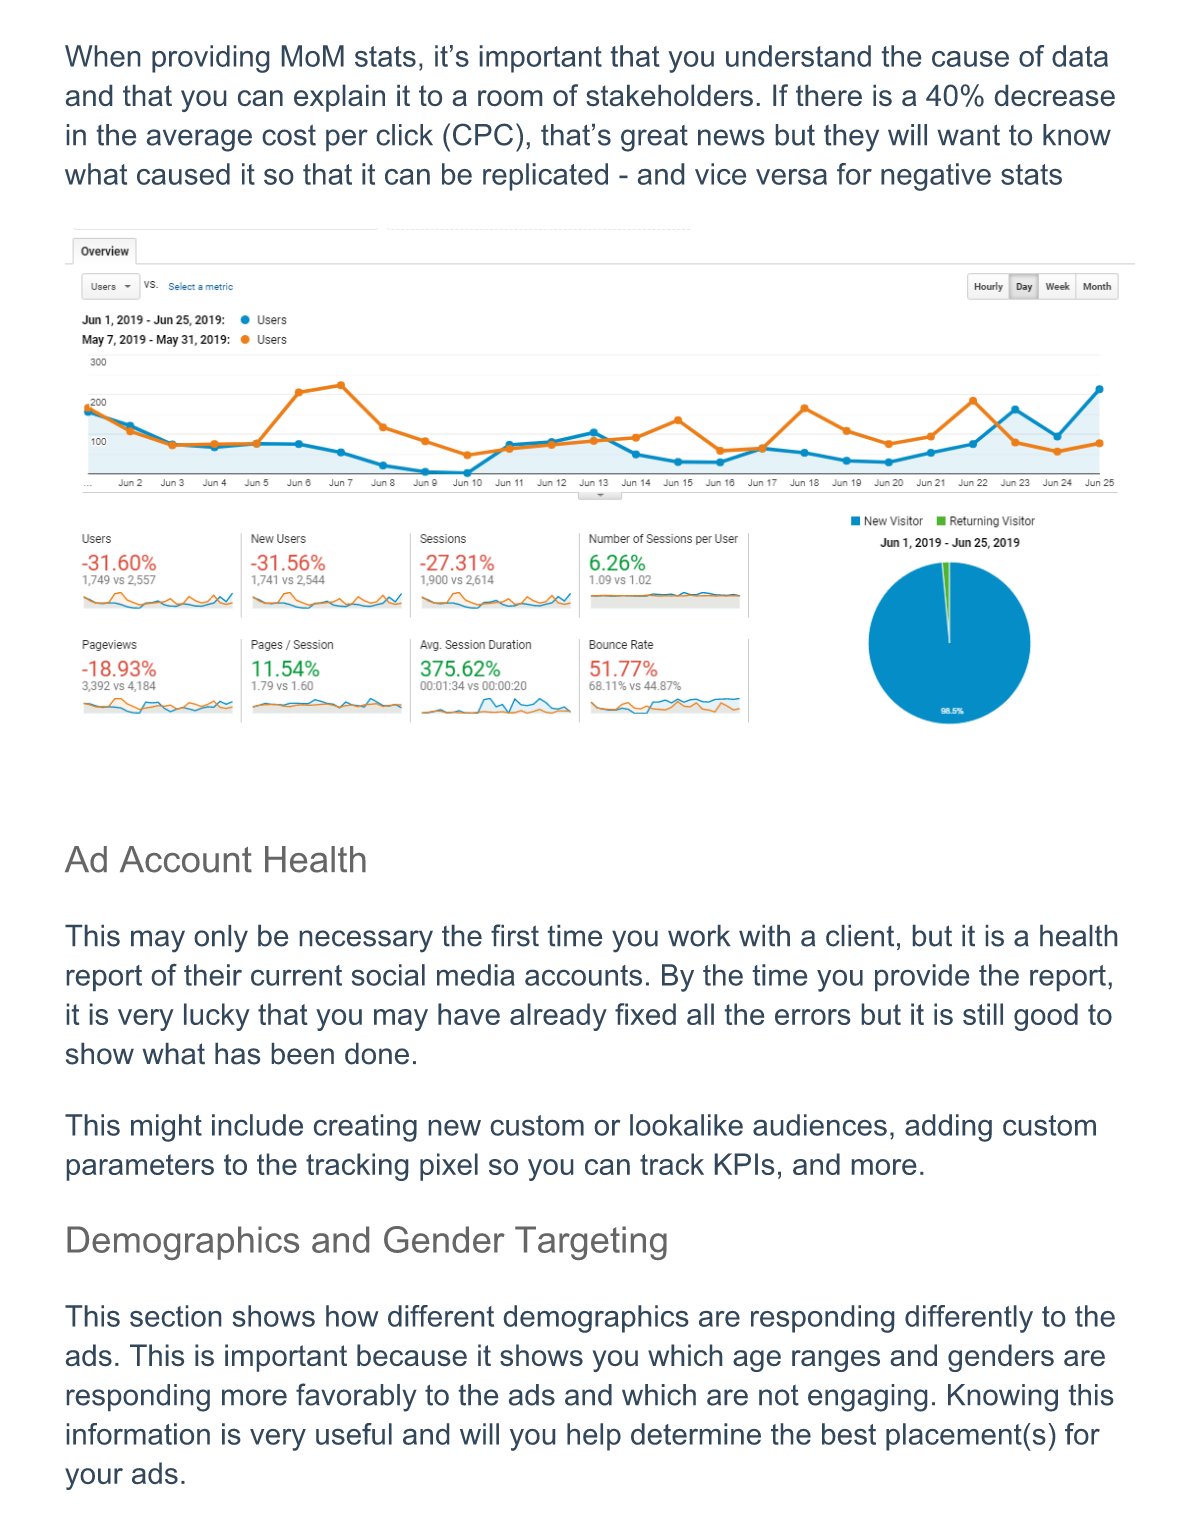
This section shows how different demographics are responding differently to the ads. This is important because it shows you which age ranges and genders are responding more favorably to the ads and which are not engaging. Knowing this information is very useful and will you help determine the best placement(s) for your ads.
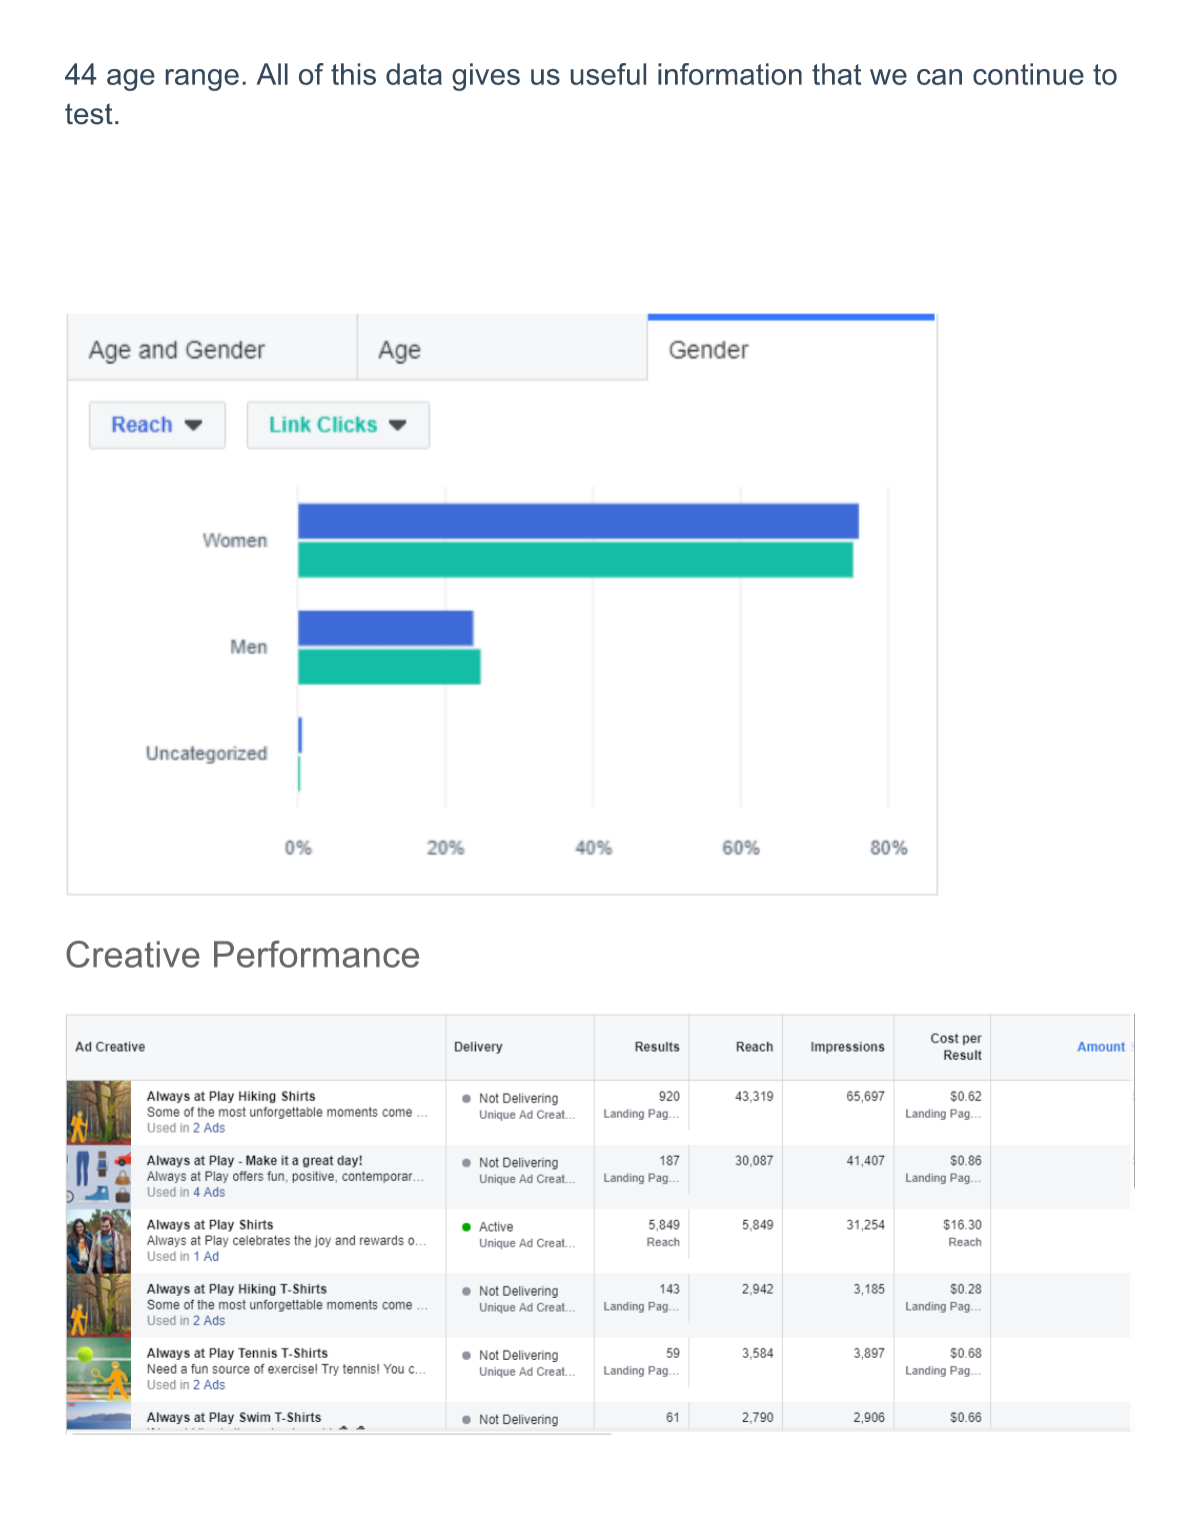
Age and Gender
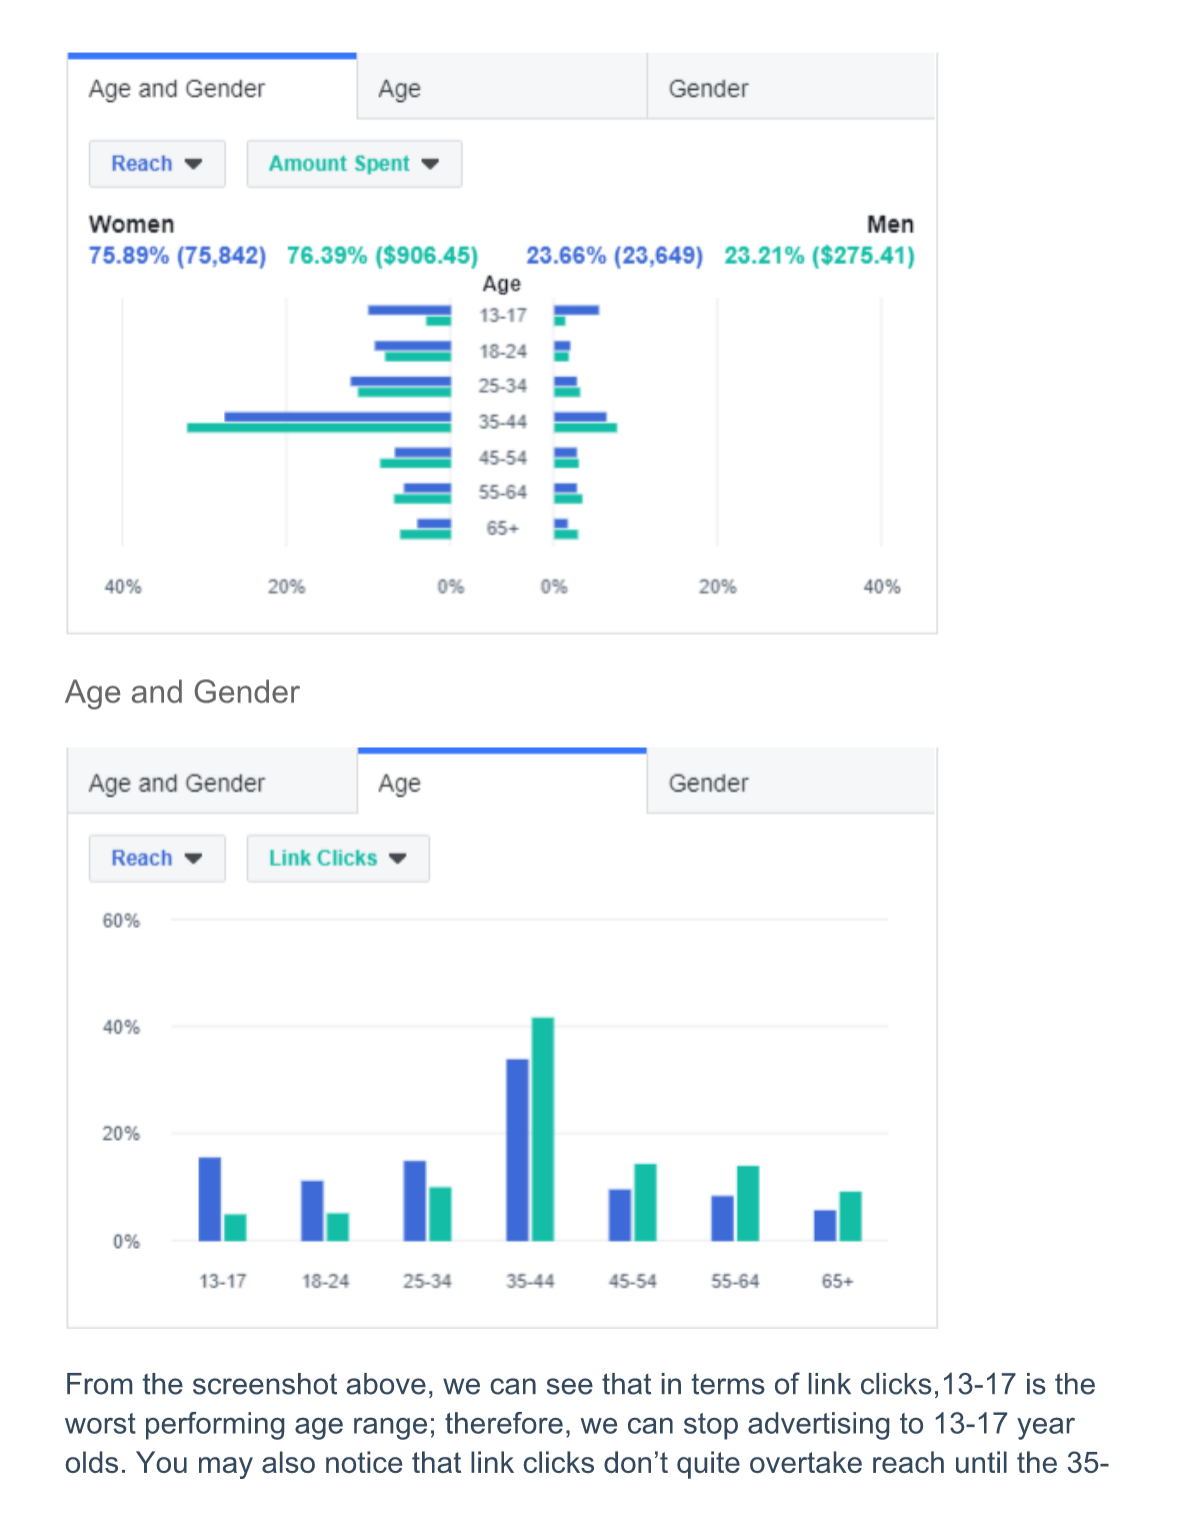
From the screenshot above, we can see that in terms of link clicks,13-17 is the worst performing age range; therefore, we can stop advertising to 13-17 year olds. You may also notice that link clicks don’t quite overtake reach until the 35-44 age range. All of this data gives us useful information that we can continue to test.
Creative Performance
This section is similar to the overall performance but instead, it’s focused solely on the creative that lead to that overall performance.
The first question is what type of creative is performing the best—videos, images, carousel ads, collections, etc., Once you’ve figured that out; what are the top-performing individual pieces of content and how can they be repurposed or improved for further campaigns? What is the worst performing content that should be avoided in the future?
If your client is an ecommerce company with their collection of products connected to their ads account, they will most likely want to know which products are over performing and underperforming.
If you’re familiar with the 80/20 rule that essentially says that 80% of your success will come from 20% of your efforts, then you know how important it is to find that 20% of creative that outperforming the other 80%.
Placement and Device Performance
This section of the report shows the client where their ads are over-performing and underperforming. Are their ads performing well on desktop but not on mobile, or on Instagram but not in Facebook? Are they performing well on the Facebook news feed, but not on the sidebar?
There is a lot of knowledge that can be gained and money that can be saved by analyzing your placement and device performance.
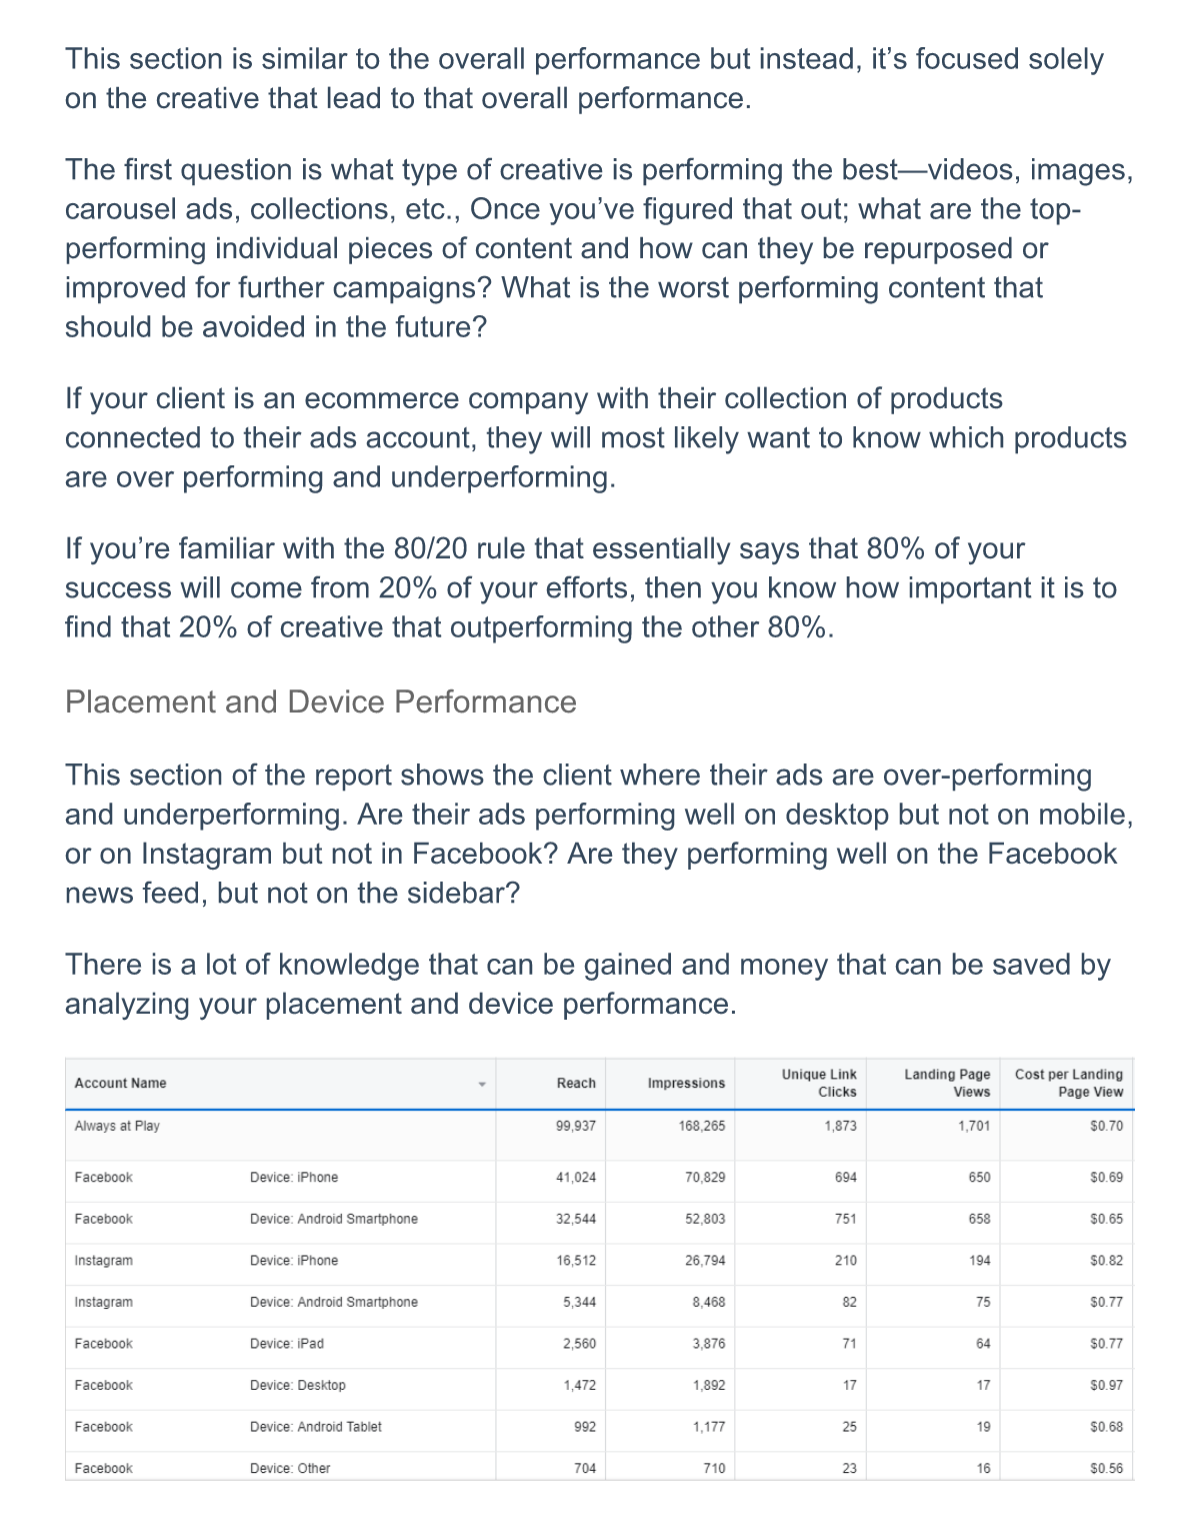
Platform and Device
From the above screenshot, we can determine which platform and device is driving the lowest cost per landing page view. By comparing the difference between unique link clicks and landing page views we can determine how many users are clicking on our links and not waiting for the page to load, usually either because they accidentally clicked or because the page load time is too slow.
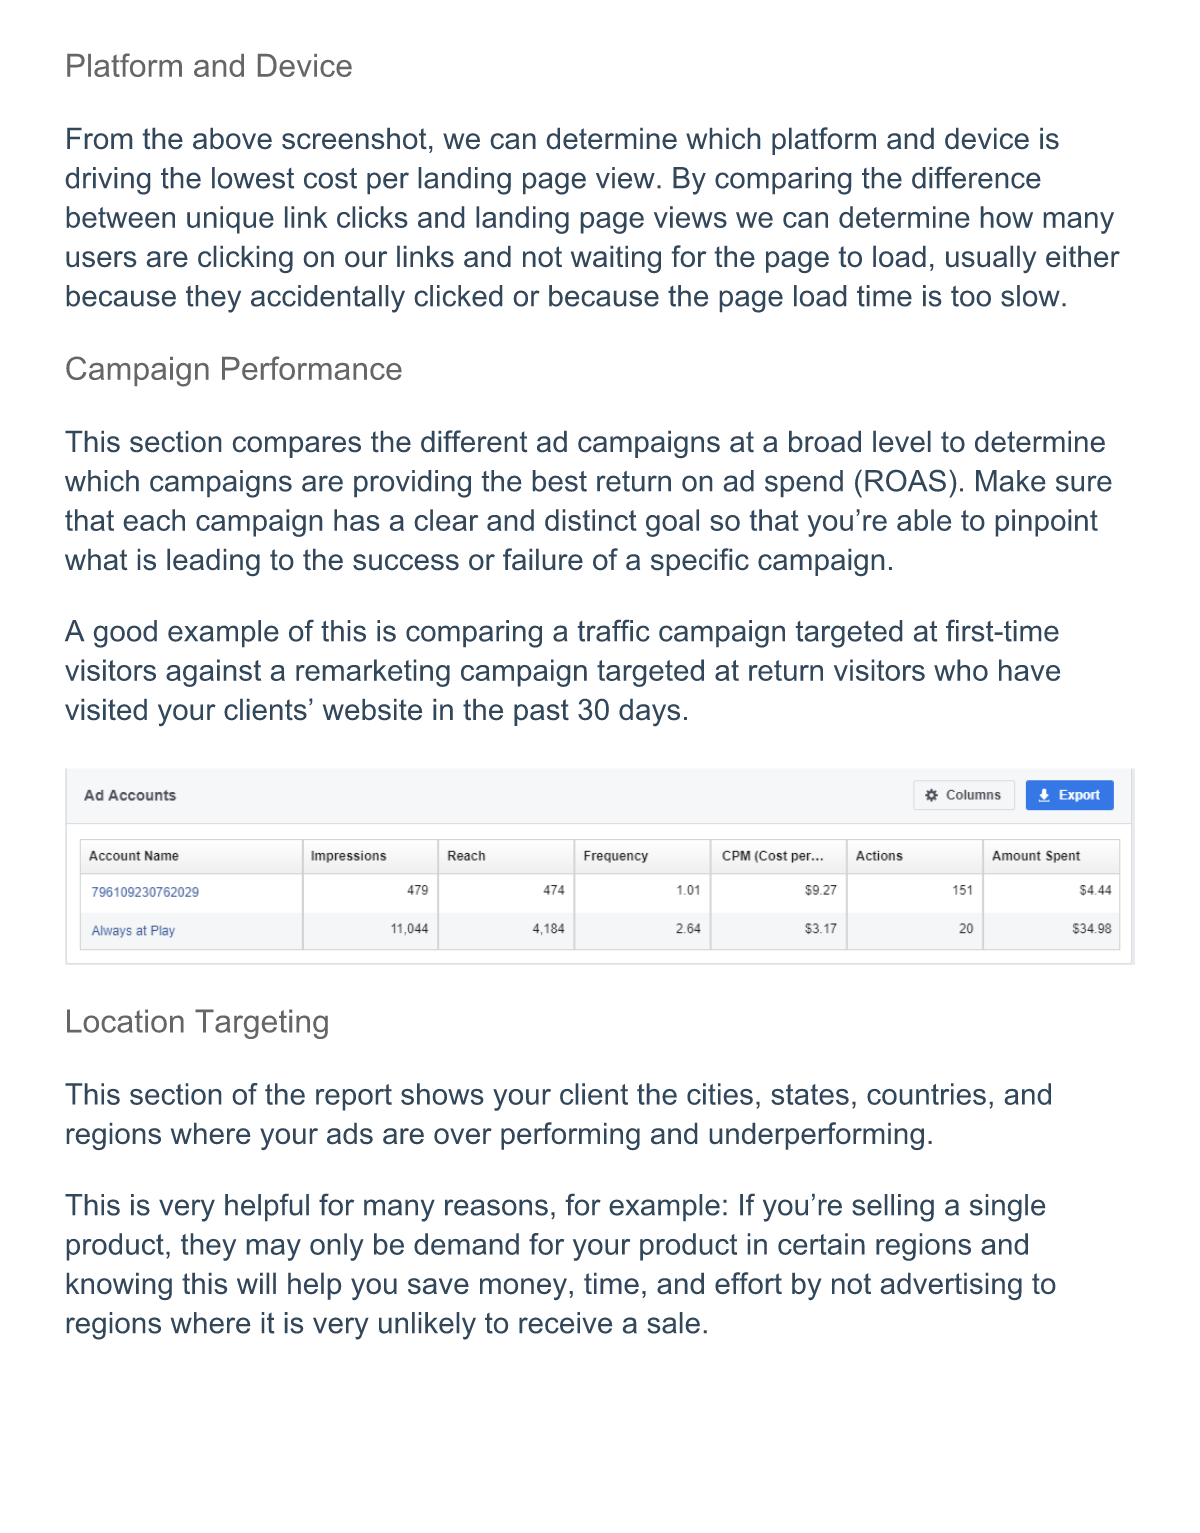
Campaign Performance
This section compares the different ad campaigns at a broad level to determine which campaigns are providing the best return on ad spend (ROAS). Make sure that each campaign has a clear and distinct goal so that you’re able to pinpoint what is leading to the success or failure of a specific campaign.
A good example of this is comparing a traffic campaign targeted at first-time visitors against a remarketing campaign targeted at return visitors who have visited your clients’ website in the past 30 days.
Location Targeting
This section of the report shows your client the cities, states, countries, and regions where your ads are over performing and underperforming.
This is very helpful for many reasons, for example: If you’re selling a single product, they may only be demand for your product in certain regions and knowing this will help you save money, time, and effort by not advertising to regions where it is very unlikely to receive a sale.
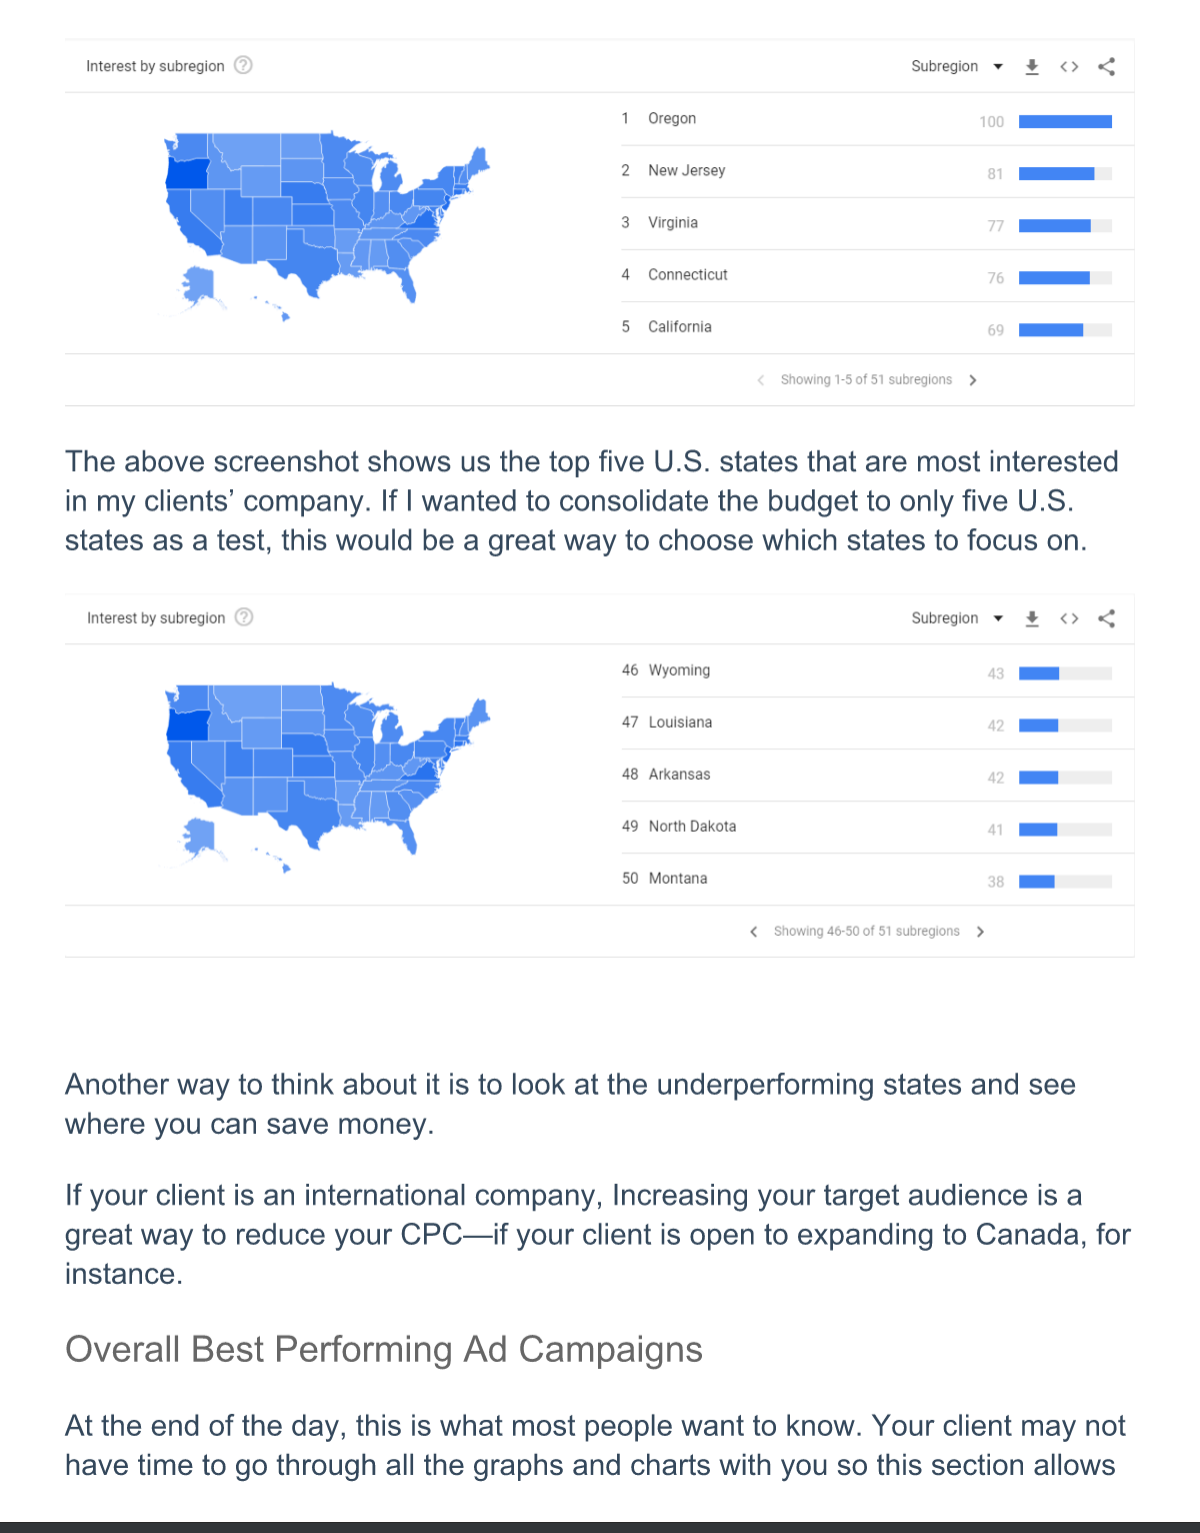
The above screenshot shows us the top five U.S. states that are most interested in my clients’ company. If I wanted to consolidate the budget to only five U.S. states as a test, this would be a great way to choose which states to focus on.
Another way to think about it is to look at the underperforming states and see where you can save money.
If your client is an international company, Increasing your target audience is a great way to reduce your CPC—if your client is open to expanding to Canada, for instance.
Overall Best Performing Ad Campaigns
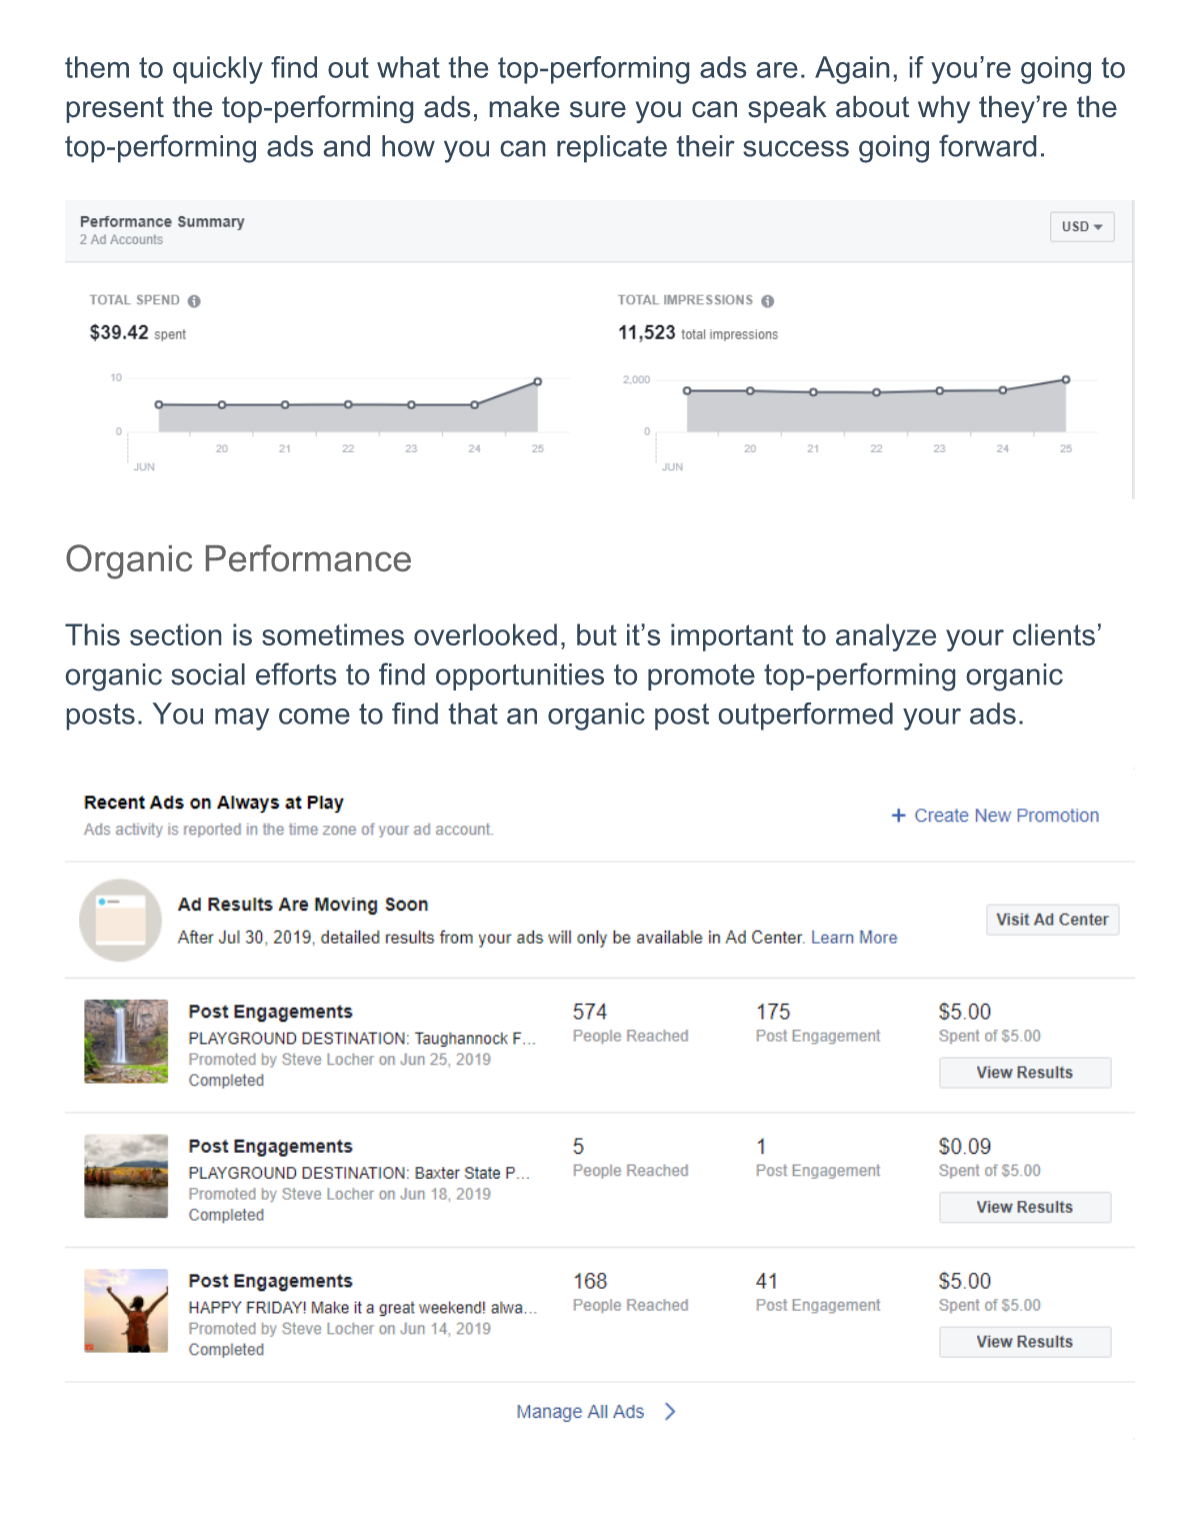
At the end of the day, this is what most people want to know. Your client may not have time to go through all the graphs and charts with you so this section allows them to quickly find out what the top-performing ads are. Again, if you’re going to present the top-performing ads, make sure you can speak about why they’re the top-performing ads and how you can replicate their success going forward.
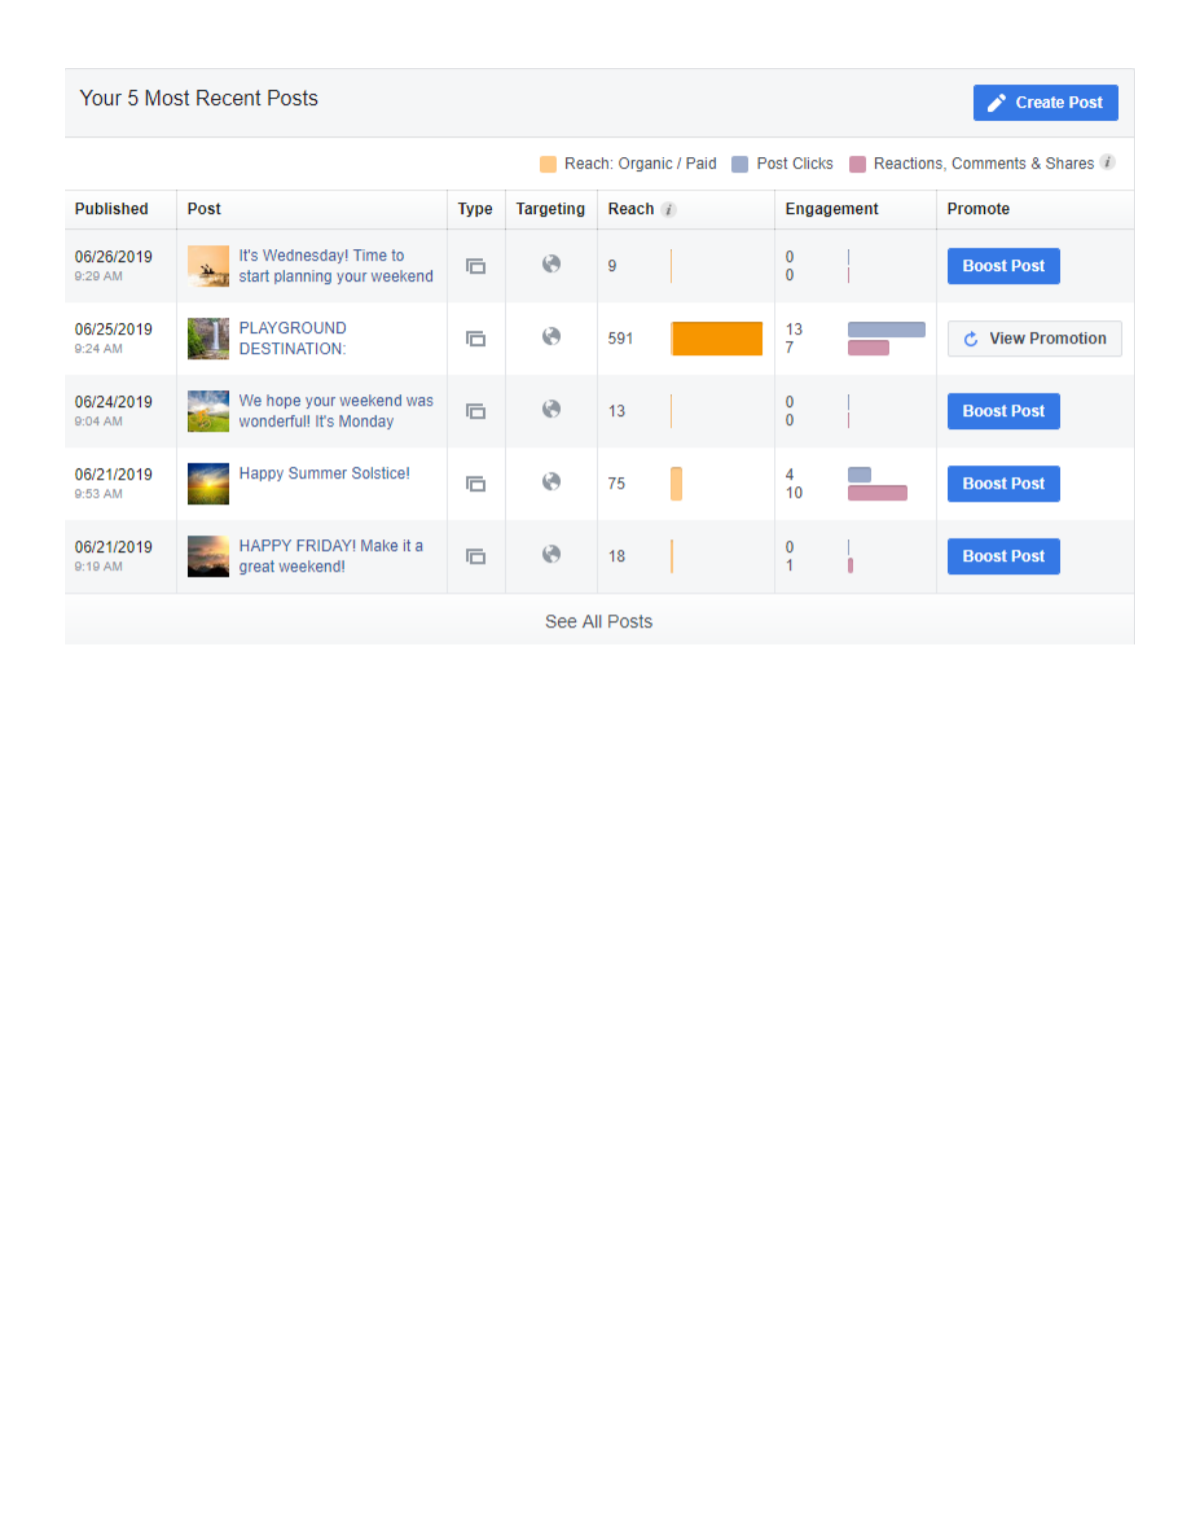
Organic Performance
This section is sometimes overlooked, but it’s important to analyze your clients’ organic social efforts to find opportunities to promote top-performing organic posts. You may come to find that an organic post outperformed your ads.
Next Steps
This section is the conclusion and summary of everything that you’ve presented above. It should include an outline of actionable next steps that you will take (based on your findings) as well as time-based goals that you intend to reach. This is your chance to set the objectives you’ll give updates on in the next report.